
11 Best client dashboard software in 2026: Guide + key features
Give your clients more than a dashboard link
Assembly is a client portal platform built for professional service firms. Embed your client dashboards from Looker Studio, Databox, and other tools directly into a branded portal, so clients access everything in one place. Try for free!
4.9 rating
- 11 Best client dashboard software: Quick comparison
- What is a client dashboard?
- Key features to look for in a client dashboard tool
- 1. AgencyAnalytics: Best for marketing agencies with multiple clients
- 2. Databox: Best for KPI tracking across sales and marketing
- 3. Whatagraph: Best for cross-channel reporting for agencies
- 4. DashThis: Best for simple marketing reporting for smaller agencies
- 5. Klipfolio: Best for custom-built, flexible dashboards
- Special mentions
- How I researched and tested these client dashboard tools
- Final verdict
- Frequently asked questions
I tested dozens of tools to find the 11 best client dashboard software options that let you share live, visual reports directly with clients. Below, I'll also cover what client dashboards are and what to look for before you commit to one.
11 Best client dashboard software: Quick comparison
Best marketing reporting tools (2026 comparison)
| Tool | Best for | Starting price | Key strengths |
|---|---|---|---|
| AgencyAnalytics | Marketing agencies with multiple clients | $20/client/month | White-label dashboards, native integrations, automated reports, client portals |
| Databox | KPI tracking across sales and marketing | $159/month | Drag-and-drop builder, integrations, goal tracking, mobile dashboards |
| Whatagraph | Cross-channel reporting for agencies | $229/month | Multi-source data blending, white-label reports, automated delivery |
| DashThis | Simple reporting for smaller agencies | $44/month | Preset KPI widgets, CSV imports, automated email reports |
| Klipfolio | Custom dashboard building | $120/month | Custom visualizations, real-time data, white-label dashboards |
| Looker Studio | Free reporting in the Google ecosystem | Free (Pro: $9/user/project/month) | Google integrations, templates, shareable dashboards |
| Domo | Enterprise data analytics | Custom pricing | Enterprise analytics, connectors, collaboration tools |
| HubSpot | CRM-connected reporting | $9/seat/month | CRM-native reports, dashboards, sales + marketing insights |
| Semrush | SEO and marketing reporting | $117.33/month | Branded reports, My Reports builder, scheduled delivery |
| Google Analytics 4 | Web analytics tracking | Free | Real-time data, custom dimensions, Google ecosystem |
| monday.com | Project dashboards with reporting | $12/seat/month | Custom widgets, workload views, timeline tracking |
What is a client dashboard?
A client dashboard is a shared, visual interface that lets your clients see the data most relevant to their work with you, without needing to ask for updates or wait on a report. It pulls metrics, project status, and performance data into a single view that your client can access on their own.
Most client dashboards are live or automatically refreshed, which means the data updates without you rebuilding the report each time. For agencies and professional service firms, this can reduce the time spent on manual reporting while giving clients more transparency into the work.
💡Tip: If you want to see what client dashboards look like in practice, check out our client dashboard examples article.
Key features to look for in a client dashboard tool
Not every dashboard tool is built the same way, and the features that matter most depend on how you work with clients. Here are the key features to look for in your dashboard tool:
- Data source integrations: The tool should connect to the platforms you already use to track client performance, whether that's Google Analytics, Meta Ads, HubSpot, or a CRM. In my experience, the more native integrations a tool has, the less time you spend manually pulling data together.
- White-labeling and custom branding: If clients are logging into a dashboard, it should reflect your brand, not the tool's. Look for options to add your logo, apply your brand colors, and use a custom domain where possible.
- Client access controls: Each client should only see their own data. Look for tools that let you set permissions by client account so there's no risk of one client seeing another's information.
- Automated reporting: The ability to schedule reports and send them automatically can save time on recurring deliverables. Some tools let you set this up once and run it on a weekly or monthly cadence.
- Ease of setup: A dashboard tool should reduce your workload, not add to it. I’d look for drag-and-drop builders and pre-built templates that let you get a working dashboard in front of a client without a long configuration process.
- Pricing structure: Some tools are priced by the number of dashboards, others by data sources or users. It's worth mapping out your client volume before committing, because the pricing model can affect your total cost more than the base price suggests.
1. AgencyAnalytics: Best for marketing agencies with multiple clients
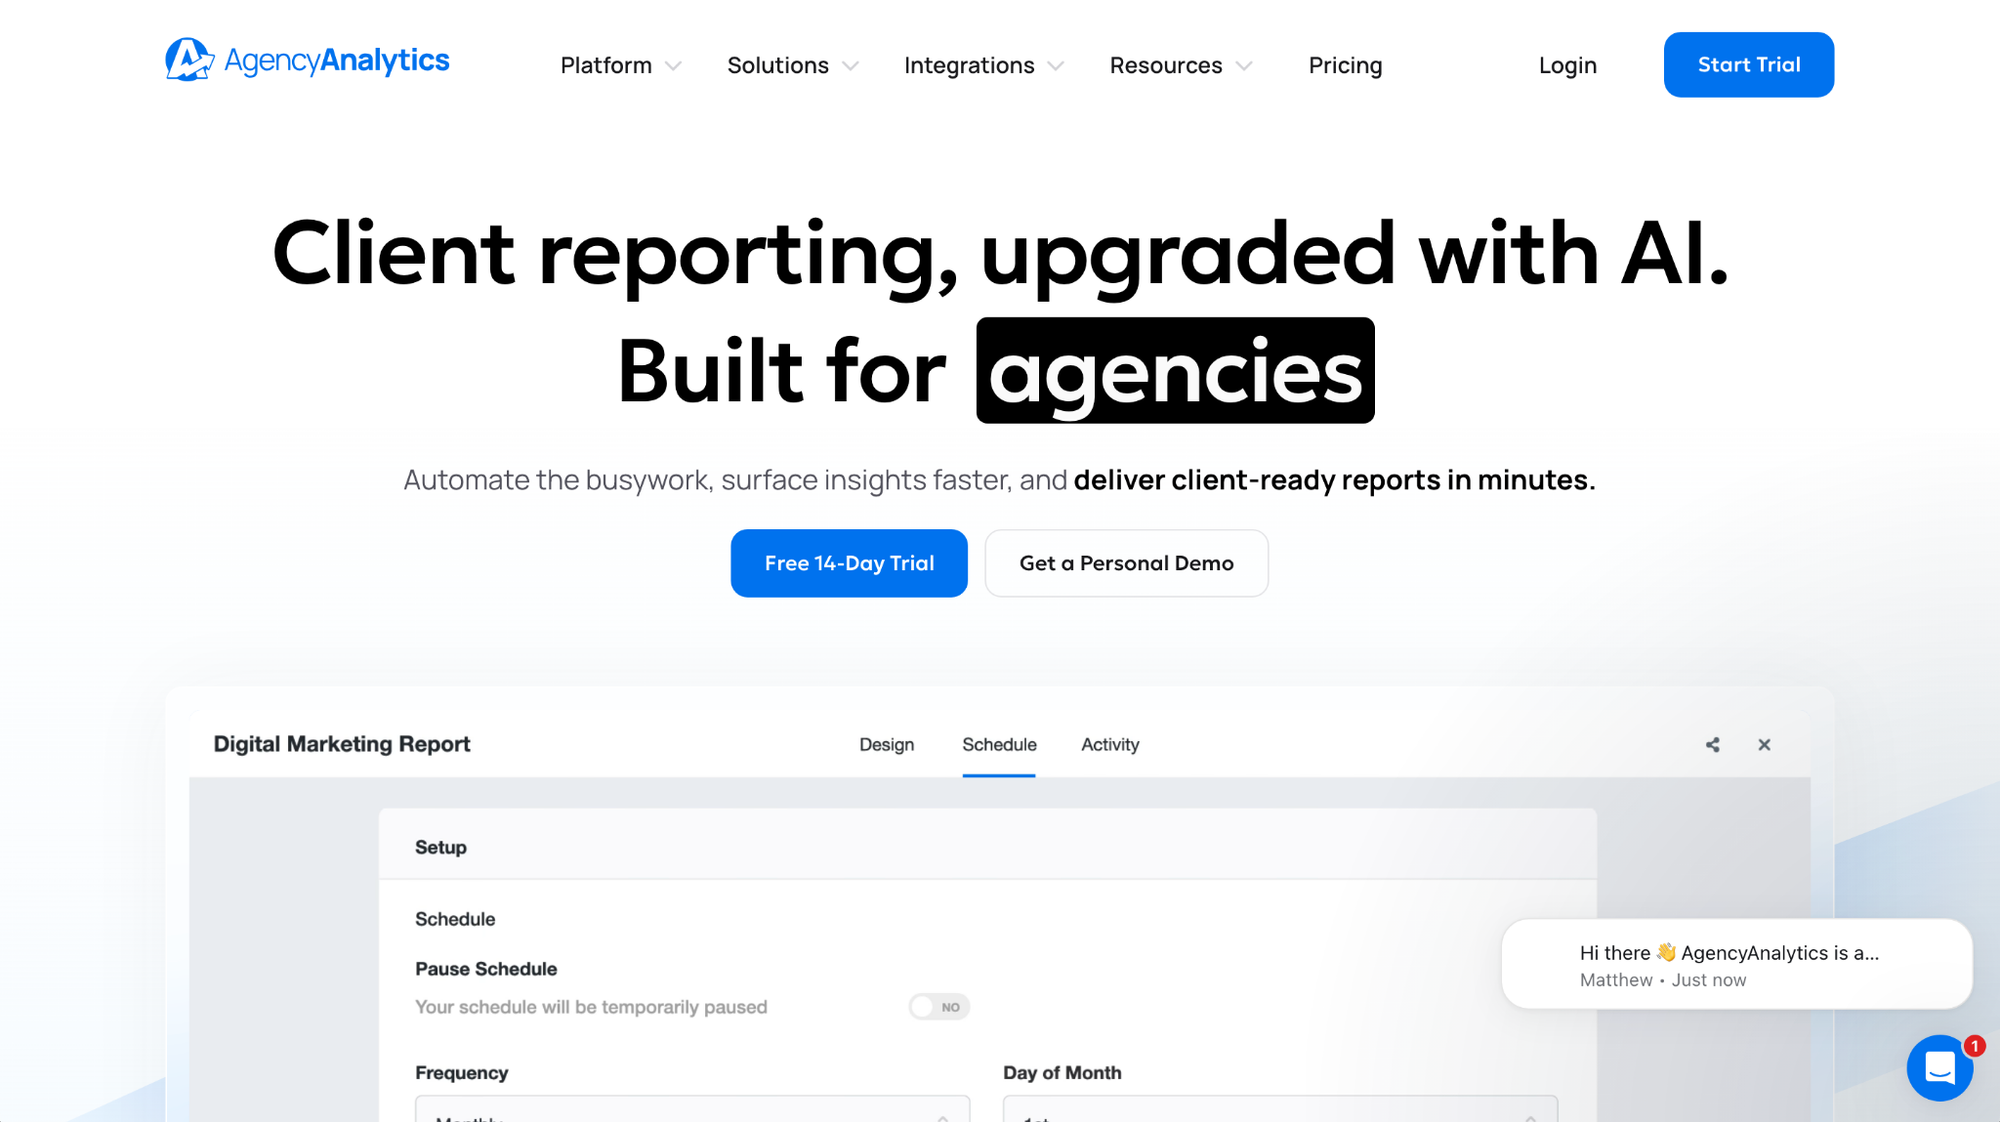
- What it does: AgencyAnalytics is a reporting platform that lets marketing agencies build white-label dashboards, automate client reports, and manage multiple client accounts from a single interface.
- Best for: Agencies managing several client accounts that need branded, automated reporting across multiple marketing channels.
I set up a sample account in AgencyAnalytics with 3 mock client dashboards to test account separation and reporting setup. Logging in as a test client confirmed that only that client's data was visible, with no crossover from other accounts. Custom chart types aren't supported outside the native widget library, so teams that need visualizations beyond standard bar, line, and pie charts may need a different tool.
Key features
- White-label client portals: Apply your agency's branding across dashboards, automated reports, and the client login experience, including a custom domain.
- Automated report scheduling: Set up recurring reports that generate and deliver to clients on a schedule you define, without manual exports each time.
- Multi-client dashboard management: Manage all client accounts from a single agency dashboard, with each client accessing only their own data through a separate login.
Pros and cons
Pros and cons
| Pros | Cons |
|---|---|
| Native integrations cover most major ad, SEO, and analytics platforms agencies rely on | Widget library can feel limited for agencies with complex or non-standard reporting needs |
| White-label options extend to the client login portal, not just the dashboard itself | Report builder customization is less flexible compared to tools like Klipfolio |
| Automated report scheduling reduces time spent on recurring monthly deliverables |
What users say
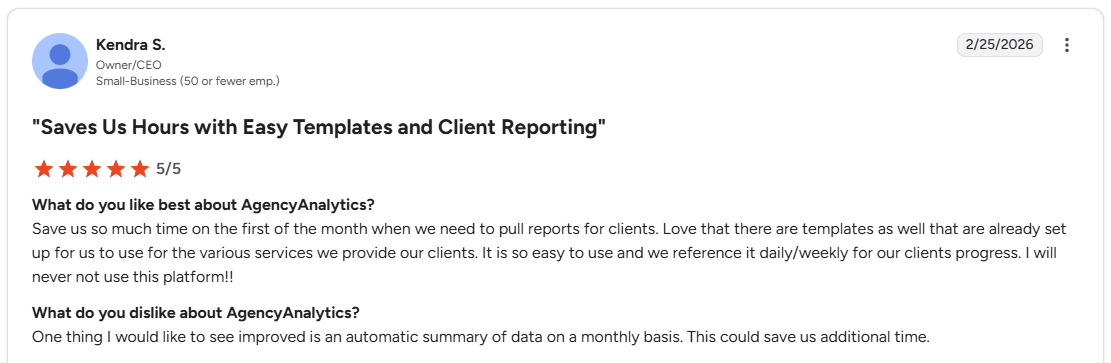
Pro: “Save us so much time on the first of the month when we need to pull reports for clients. Love that there are templates as well that are already set up for us to use for the various services we provide our clients.” - Kendra S., G2
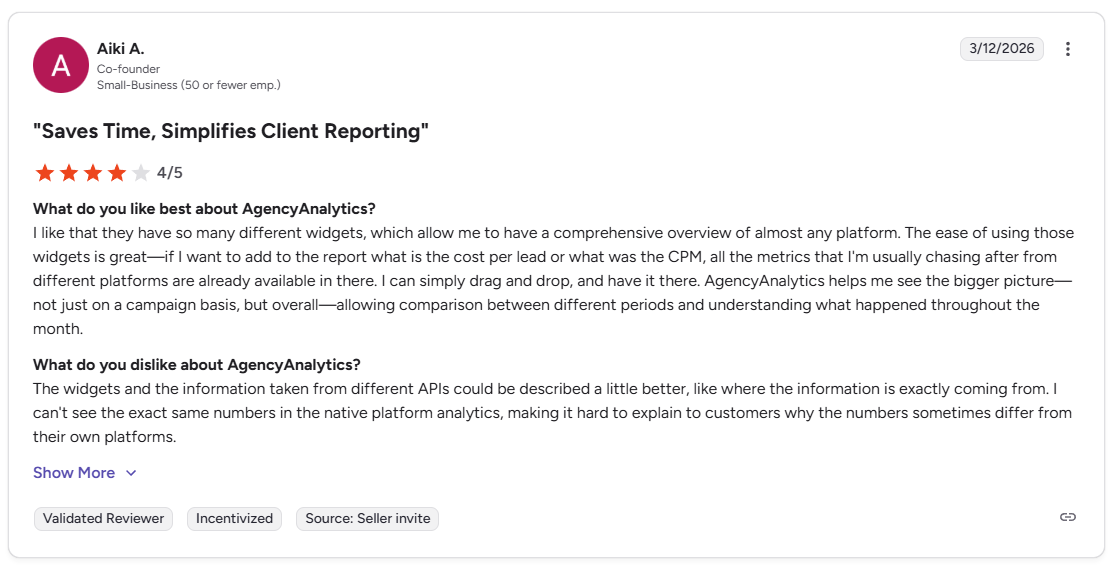
Con: “I can't see the exact same numbers in the native platform analytics, making it hard to explain to customers why the numbers sometimes differ from their own platforms.” - Aiki A., G2
Pricing
AgencyAnalytics starts at $20 per client per month.
Bottom line
AgencyAnalytics includes built-in SEO audit tools alongside its reporting, which can reduce the need for a separate rank tracking platform. If you need more flexibility in how your data is structured and visualized, Klipfolio might be a better fit.
2. Databox: Best for KPI tracking across sales and marketing
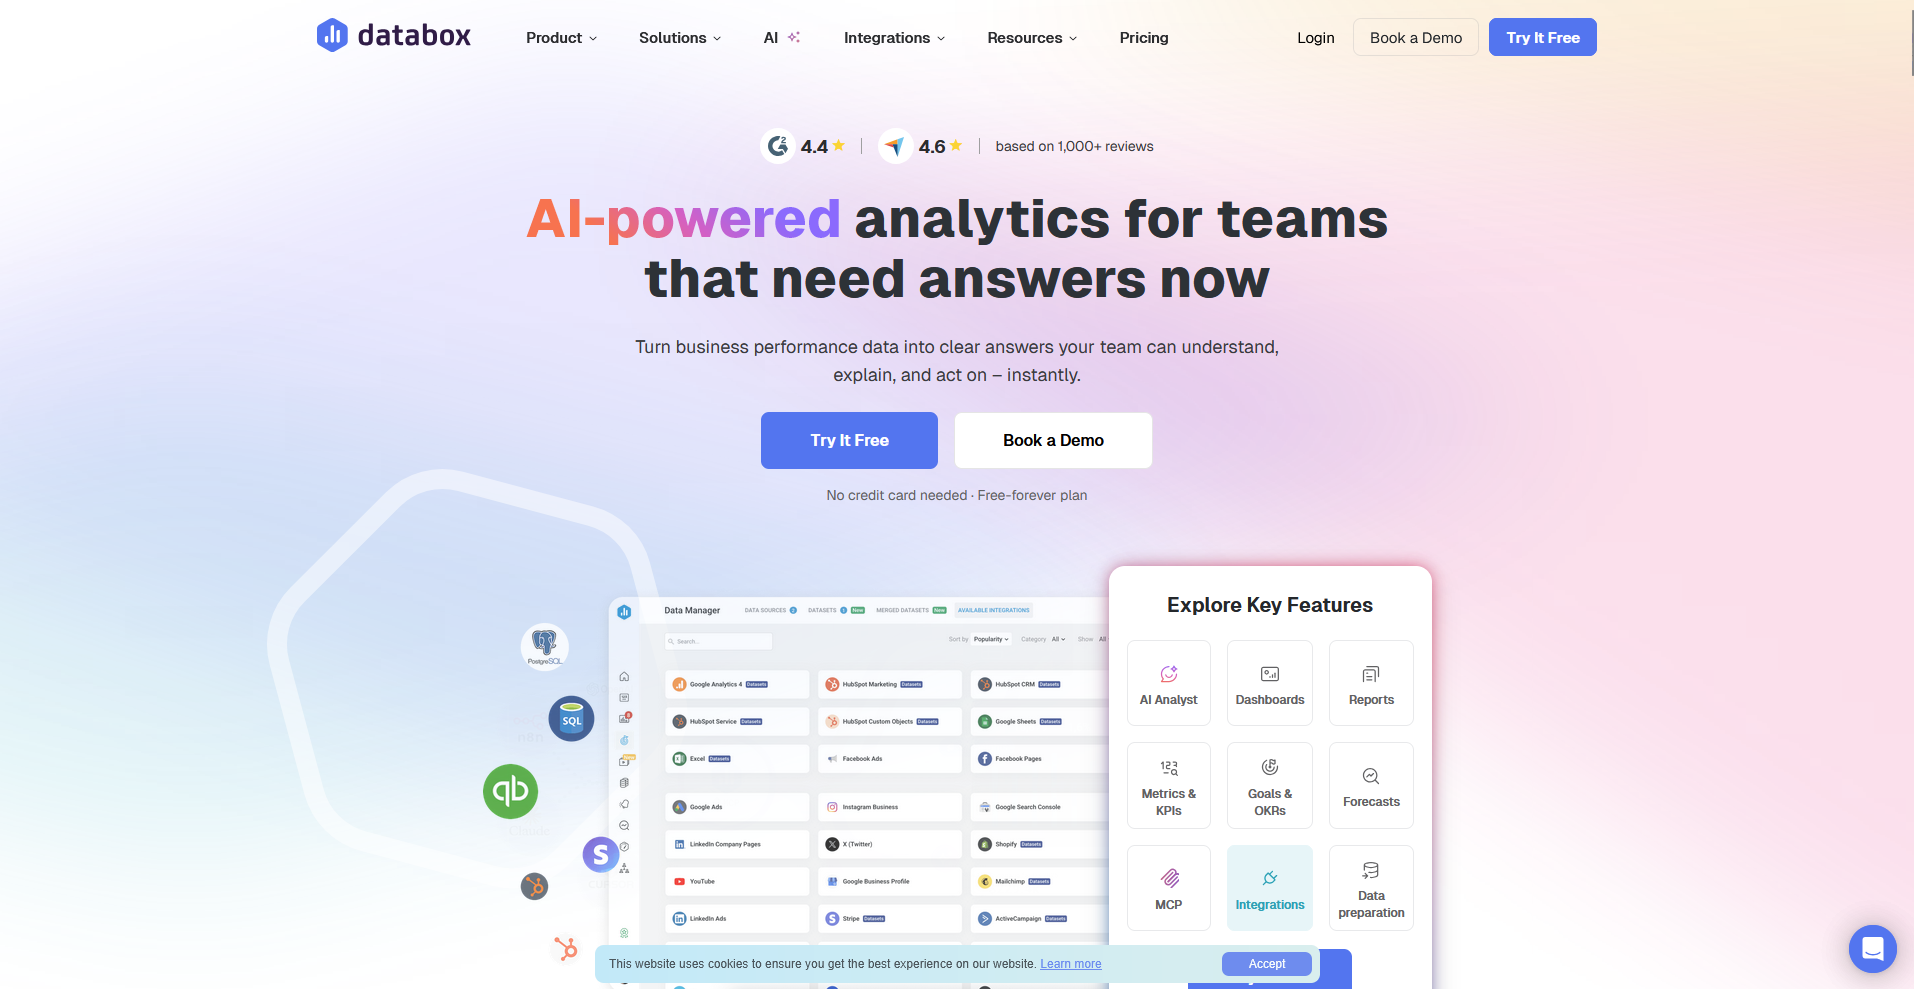
- What it does: Databox is a KPI tracking and dashboard platform that lets you pull data from multiple sources into a single view for reporting and performance monitoring.
- Best for: Sales and marketing teams that need to track KPIs across multiple platforms without building a data warehouse.
I built a sample Databox dashboard tracking campaign performance across HubSpot and Google Analytics to test how the goal tracking feature ties live data to client targets. I found that setting a revenue goal against a live HubSpot metric updated the progress indicator in real time. White-label options are limited on lower tiers, so client-facing dashboards will carry Databox branding unless you upgrade.
Key features
- Drag-and-drop dashboard builder: Build and arrange KPI visualizations by dragging metrics from connected data sources onto a canvas without writing code.
- Goal tracking: Set performance targets against live metrics and display progress directly on the dashboard so clients can see how results track against agreed goals.
- Mobile dashboards: Access and share dashboards from a mobile app, with the same live data available on desktop.
Pros and cons
Pros and cons
| Pros | Cons |
|---|---|
| Pre-built templates cover common sales and marketing KPI setups | Base plan includes only 3 data source connections, limiting multi-channel reporting |
| Goal tracking ties live performance data directly to agreed client targets | White-label options are limited compared to purpose-built agency reporting tools |
| Broad integration library covers most major marketing and sales platforms |
What users say
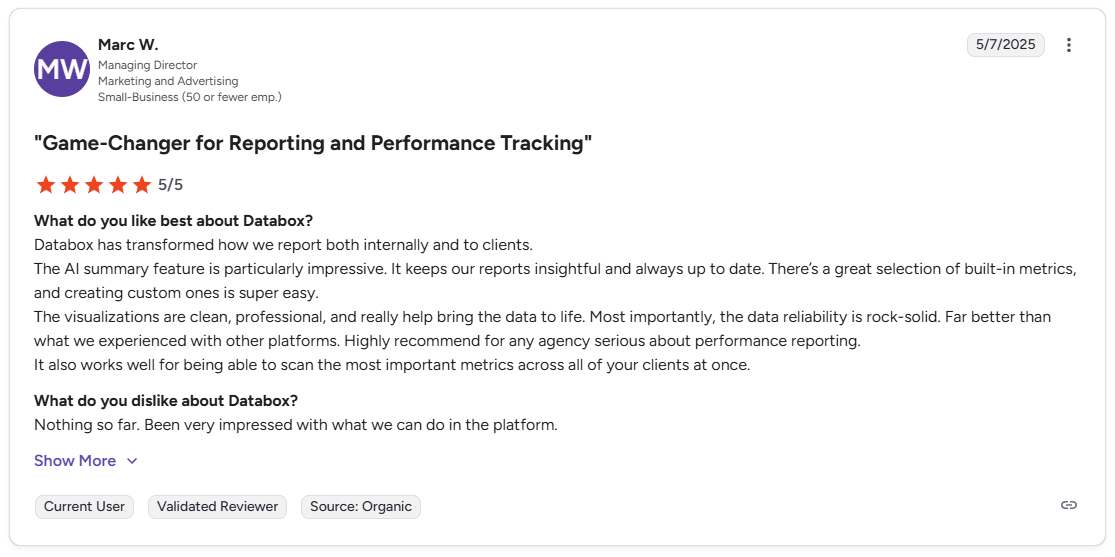
Pro: “Databox has transformed how we report both internally and to clients. … The visualizations are clean, professional, and really help bring the data to life. … The data reliability is rock-solid.” - Marc W., G2
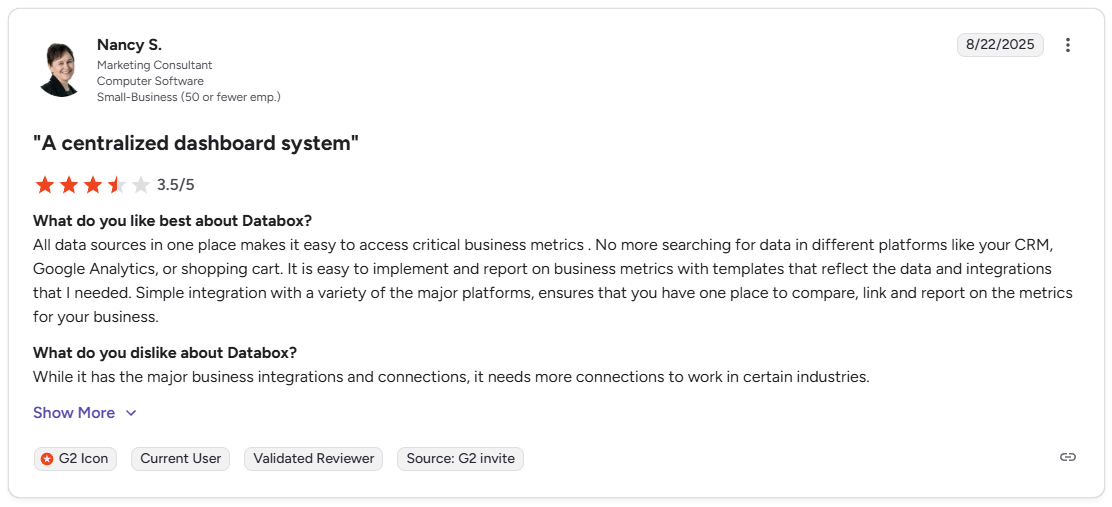
Con: “While it has the major business integrations and connections, it needs more connections to work in certain industries.” - Nancy S., G2
Pricing
Databox starts at $159 per month, with 3 data sources included. Each additional source is $5.60.
Bottom line
Databox's goal tracking feature lets you set performance targets against live metrics and display progress directly on the dashboard. If you need stronger white-label capabilities and branded client portals, AgencyAnalytics might be a better fit.
3. Whatagraph: Best for cross-channel reporting for agencies
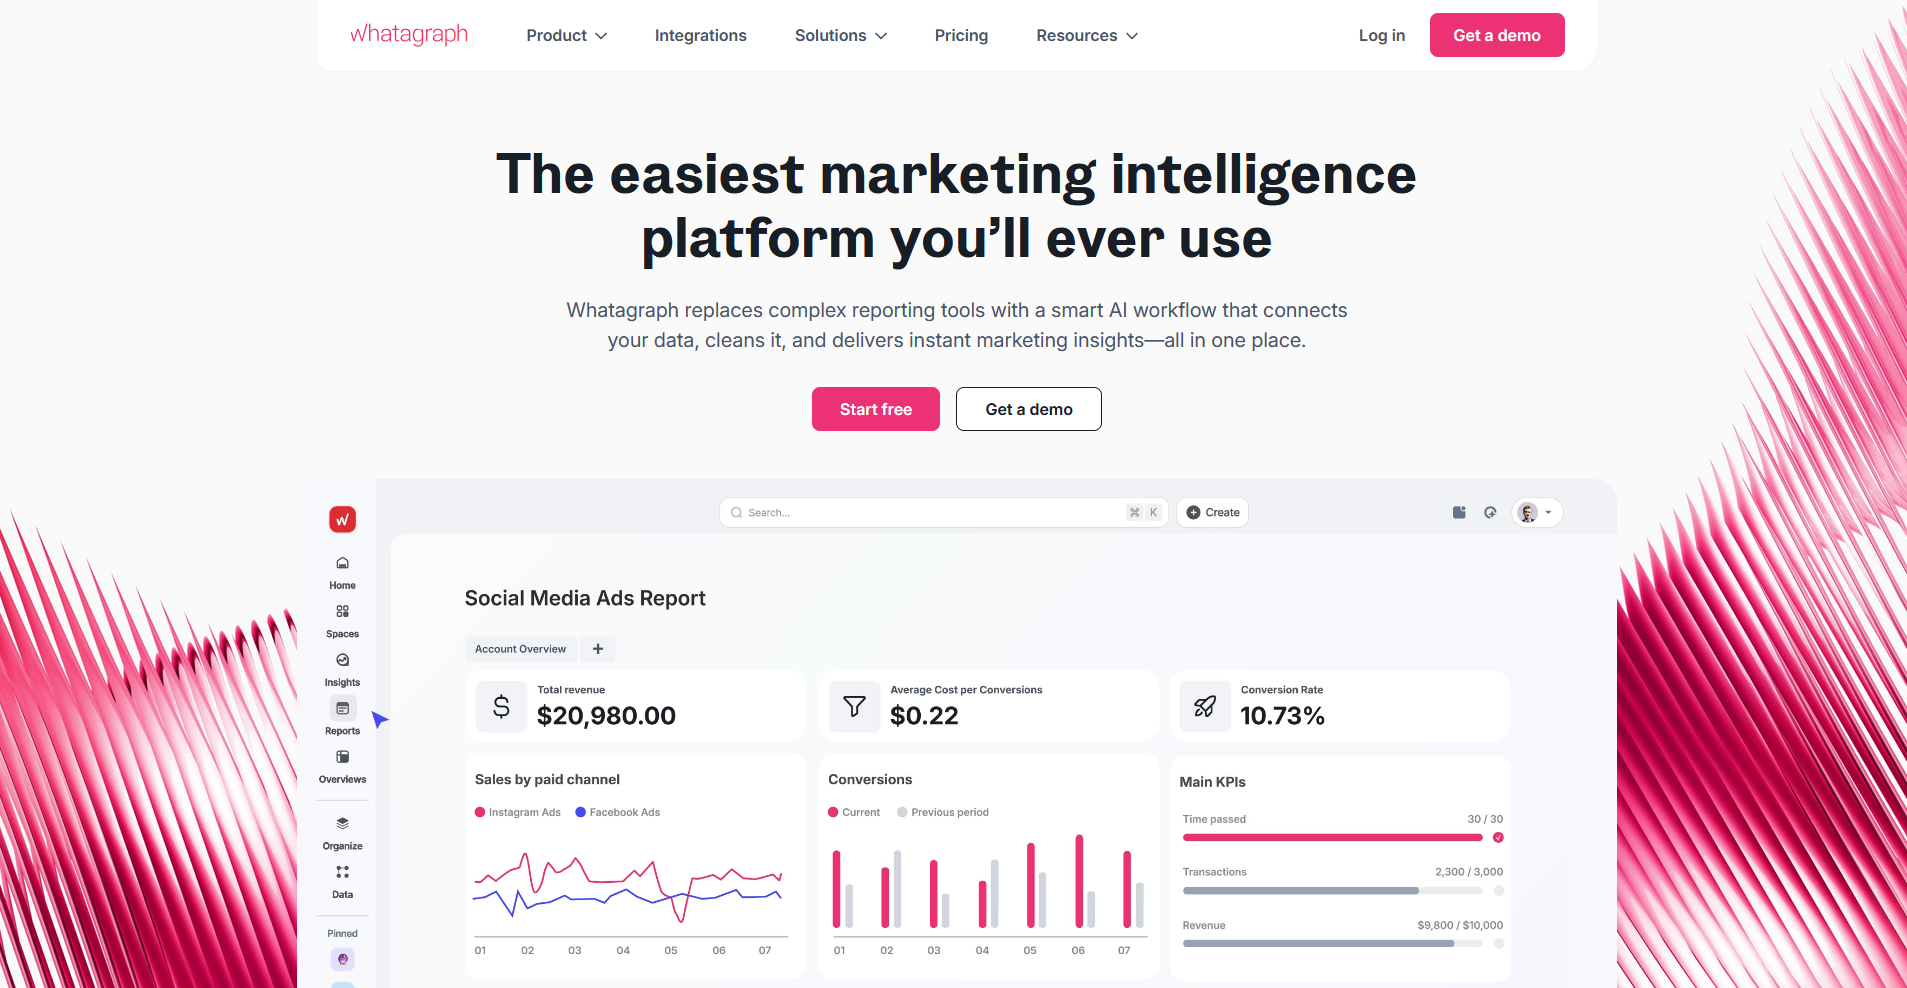
- What it does: Whatagraph is a marketing reporting platform that lets agencies pull data from multiple channels into branded, shareable dashboards and automated reports.
- Best for: Agencies that need to blend data from multiple marketing channels into a single client-facing report without manual exports.
I built a sample cross-channel report in Whatagraph to test how well it handles blending data from multiple sources. Data from Google Analytics, Meta Ads, and LinkedIn combined into a single view without manual workarounds. However, offline and custom data sources are less flexible to connect compared to tools built around custom data pipelines.
Key features
- Multi-source data blending: Combine metrics from multiple platforms into a single report view without switching between dashboards or manually merging data.
- White-label report delivery: Apply custom branding to reports and deliver them to clients under your agency's name, including branded email delivery.
- Automated report scheduling: Set reports to generate and send automatically on a defined cadence, without rebuilding them each time.
Pros and cons
Pros and cons
| Pros | Cons |
|---|---|
| Data blending across multiple sources works without manual workarounds | Higher starting price than most purpose-built reporting tools on this list |
| White-label options extend to branded email report delivery | Custom visualizations are limited to the chart types available in the report builder |
| Wide integration library covers most major ad, SEO, and analytics platforms |
What users say
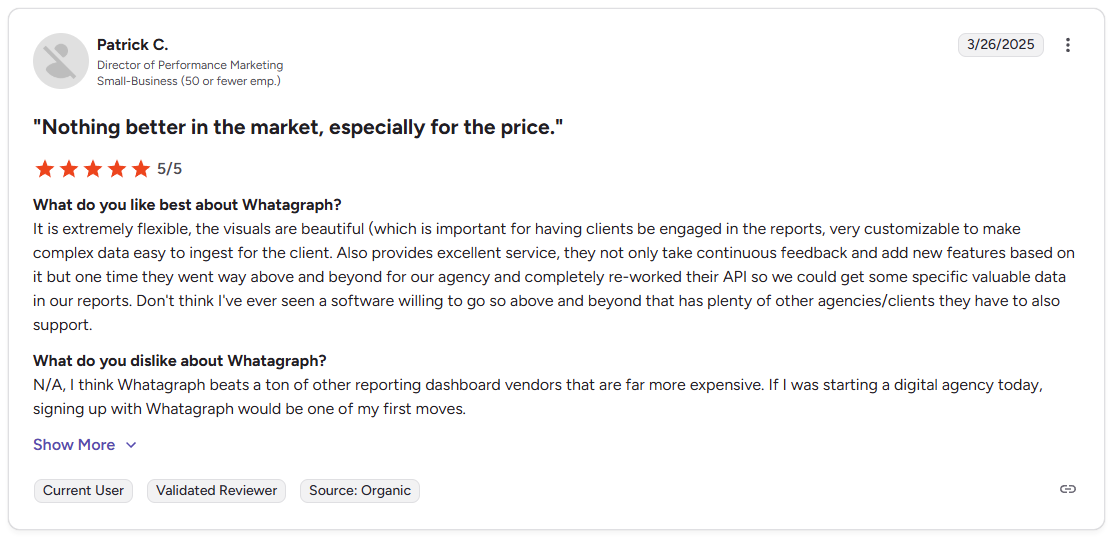
Pro: “It is extremely flexible, the visuals are beautiful … very customizable to make complex data easy to ingest for the client.” - Patrick C., G2
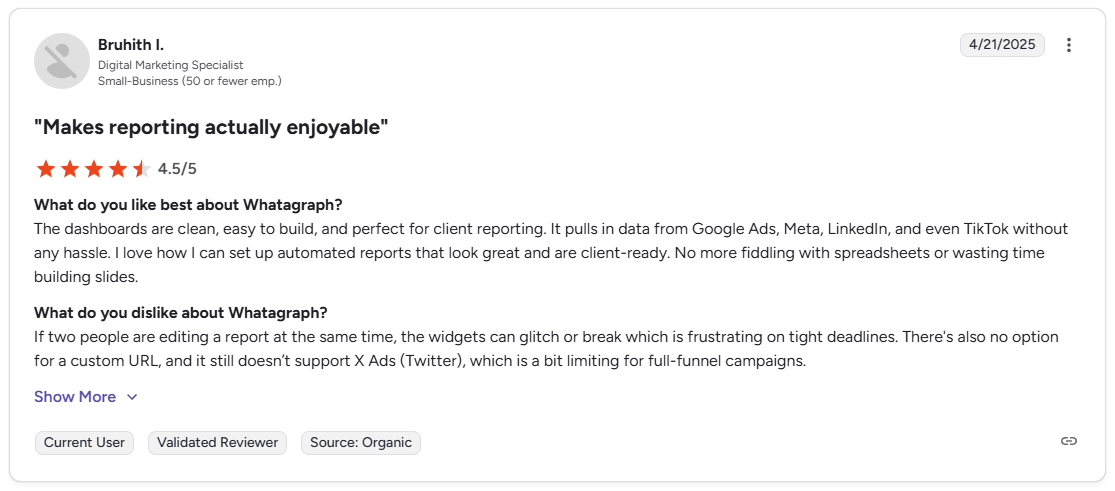
Con: “If two people are editing a report at the same time, the widgets can glitch or break, which is frustrating on tight deadlines. There's also no option for a custom URL, and it still doesn't support X Ads (Twitter), which is a bit limiting for full-funnel campaigns.” - Bruhith I., G2
❗Note: At the time of this review, the user noted the lack of a custom URL option. However, the Max and Prime plans now include custom domain features for white-labeling.
Pricing
Whatagraph starts at $229 per month.
Bottom line
Whatagraph's data blending capability lets you combine metrics from different platforms into a single report row, which reduces the need to present channel data separately. If you need a more affordable entry point for single-channel reporting, DashThis could be worth a look.
4. DashThis: Best for simple marketing reporting for smaller agencies
- What it does: DashThis is a marketing reporting tool that lets agencies build automated, white-label client dashboards by connecting data from major marketing platforms.
- Best for: Smaller agencies that need a straightforward way to build and share branded marketing reports without a complex setup process.
I connected Google Analytics and Search Console in DashThis for a mock SEO client to test how fast it gets to a shareable dashboard. Using the preset KPI widgets, I had a client-ready dashboard showing traffic, conversions, and ranking data in under 20 minutes. DashThis relies on its own built-in widget and chart types, so you customize within those options rather than building custom visualizations.
Key features
- Preset KPI widgets: Choose from a library of pre-built marketing metrics widgets that populate automatically once a data source is connected.
- CSV data imports: Upload offline or custom data via CSV to include non-native data sources in your client dashboards.
- Automated email reports: Schedule dashboards to deliver automatically to clients by email on a cadence you define.
Pros and cons
Pros and cons
| Pros | Cons |
|---|---|
| Preset widgets reduce setup time for standard marketing dashboards | Customization options are narrower than more flexible dashboard builders |
| CSV imports allow offline data to be included alongside platform data | Dashboard pricing model means costs scale with the number of dashboards, not users |
| White-label options cover logos, colors, and custom domain |
What users say
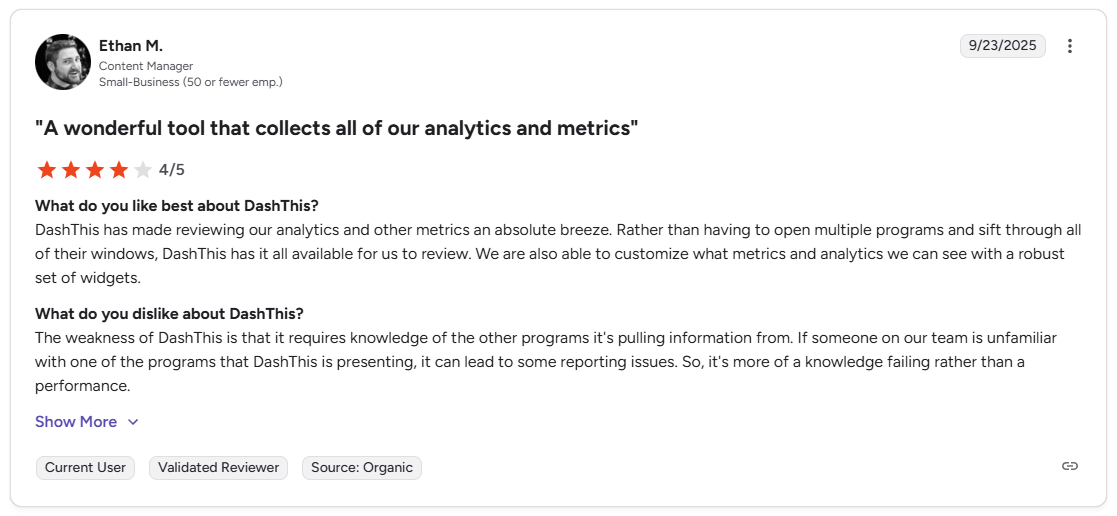
Pro: “DashThis has made reviewing our analytics and other metrics an absolute breeze. Rather than having to open multiple programs and sift through all of their windows, DashThis has it all available for us to review. We are also able to customize what metrics and analytics we can see with a robust set of widgets.” - Ethan M., G2
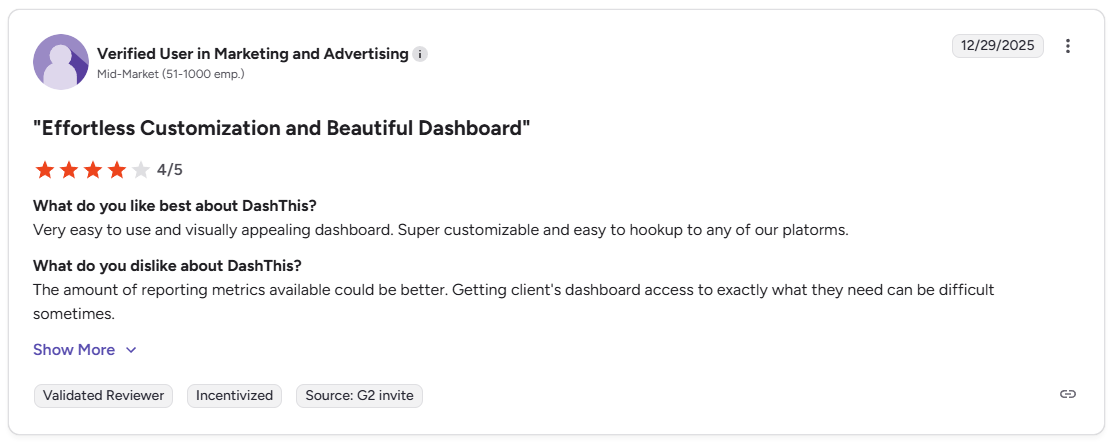
Con: “The amount of reporting metrics available could be better. Getting [clients'] dashboard access to exactly what they need can be difficult sometimes.” - Verified User, G2
Pricing
DashThis starts at $44 per month.
Bottom line
DashThis prices by the number of dashboards rather than by users, which can work in favor of smaller agencies with a set client roster. If you need cross-channel data blending across a larger client base, Whatagraph might be a better fit.
5. Klipfolio: Best for custom-built, flexible dashboards
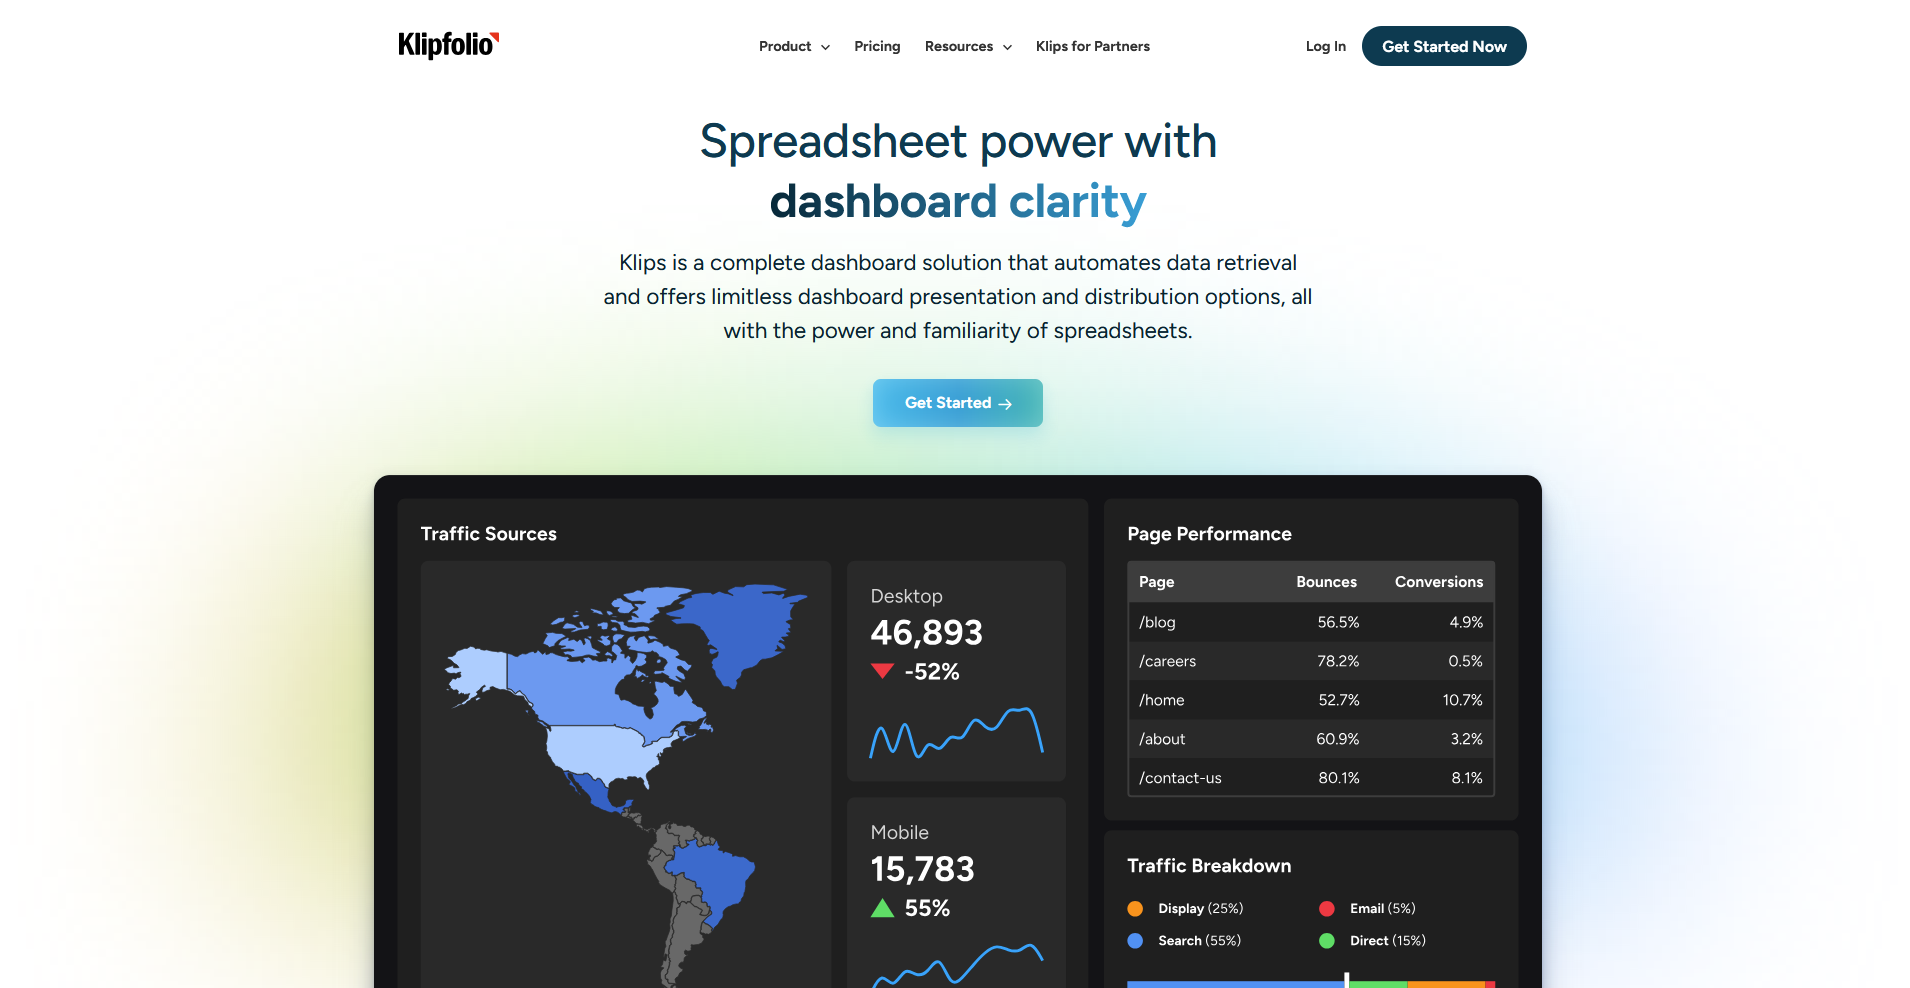
- What it does: Klipfolio is a dashboard platform that lets you build custom, data-connected dashboards using a flexible visualization builder and a broad library of integrations.
- Best for: Teams that need more control over how their data is structured and visualized than standard reporting templates allow.
I connected several data sources in Klipfolio to test how far the customization options go. The formula editor lets you manipulate data directly within the dashboard, so you can calculate custom metrics without transforming data upstream. Building a polished dashboard takes more time than preset-driven tools, since you'll need to be comfortable writing data formulas to get the most out of the platform.
Key features
- Custom data visualizations: Build charts, tables, and graphs using a flexible editor that supports custom formulas and calculated metrics.
- White-label options: Apply custom branding to dashboards including logos, colors, and a custom domain for client-facing delivery.
- Broad integration library: Connect to a wide range of marketing, sales, and analytics platforms through native integrations and API connections.
Pros and cons
Pros and cons
| Pros | Cons |
|---|---|
| Formula editor lets you calculate custom metrics directly within the dashboard | Full white-labeling with custom domain access is available on higher-tier agency plans only |
| White-label options cover logos, colors, and custom domain | Building a polished dashboard takes more time than template-based tools |
| Broad integration library includes API connections for non-native data sources |
What users say
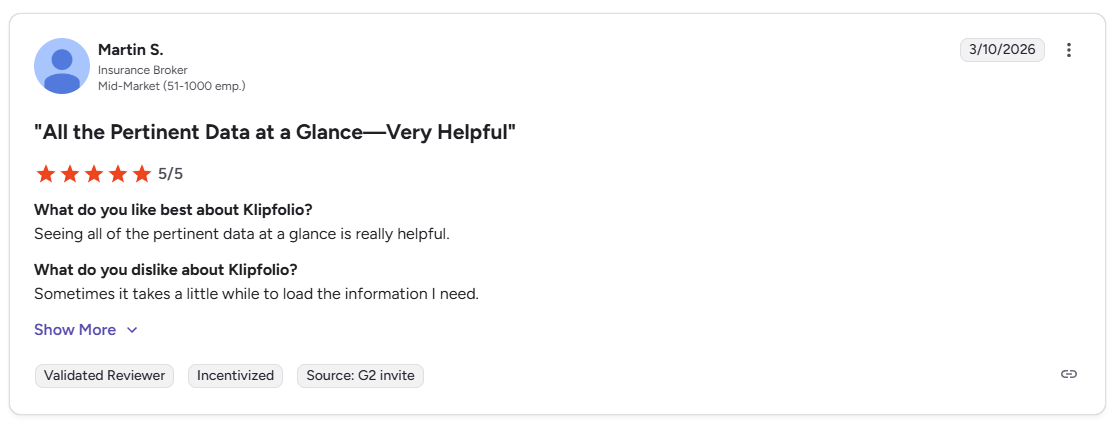
Pro: “Seeing all of the pertinent data at a glance is really helpful.” - Martin S., G2
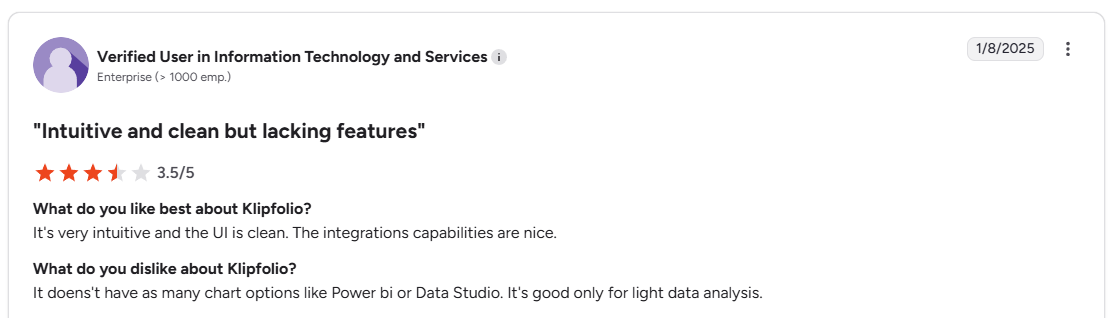
Con: “It doesn't have as many chart options like Power BI or Data Studio. It's good only for light data analysis.” - Verified User, G2
Pricing
Klipfolio starts at $120 per month, includes 3 dashboards.
Bottom line
Klipfolio's formula editor lets you define and calculate custom metrics directly inside the dashboard, which reduces the need to pre-process data before it comes in. If you need a faster setup with pre-built KPI templates and less configuration, Databox might be a better fit.
Special mentions
These 6 tools didn't make the main list, but depending on your reporting needs or the data sources you rely on, one of them may be a better fit.
Here are 6 more client dashboard tools worth a look:
- Looker Studio: Looker Studio is a free Google tool that lets you build custom dashboards by connecting sources like Google Analytics, Google Ads, and Search Console. The setup takes more manual work than purpose-built tools since you're building from scratch rather than using pre-configured client reporting templates, but it’s flexible and available for free.
- Domo: Domo is a cloud-based BI platform that connects to hundreds of data sources and consolidates them into a single dashboard view. It handles complex, multi-source reporting well, but the platform is built around enterprise-scale use cases, which may be more than a smaller agency needs.
- HubSpot: HubSpot includes a dashboard builder that pulls directly from its CRM, covering sales pipelines, marketing performance, and contact activity. It works well if your client data already lives in HubSpot, but teams running other CRMs will find the reporting limited to what HubSpot can access.
- Semrush: Semrush includes a My Reports builder that lets you create branded, client-facing SEO and marketing reports by pulling from its own data alongside Google Analytics and Search Console. It works well for agencies already using Semrush for SEO, but it's not a substitute for a full cross-channel dashboard tool.
- Google Analytics 4 (GA4): GA4 is Google's free web analytics platform that lets you build custom reports and share view access with clients. It covers website traffic, conversions, and user behavior well, but the interface takes time to learn and isn't designed with client presentation in mind.
- monday.com: monday.com includes a dashboard feature that pulls data from your boards into visual summaries covering task status, workload, and timelines. It works well for project visibility, but teams that need marketing or analytics reporting will need to pull in data from outside sources to make it more useful for clients.
How I researched and tested these client dashboard tools
I tested each platform by building sample dashboards, connecting live data sources, and walking through the full process of sharing reports with a simulated client to see how well the setup and delivery experience performs in practice.
Here's what I considered:
- Data source integrations: How many native connectors each tool offers and how straightforward it is to pull in data from platforms like Google Analytics, Meta Ads, and HubSpot without manual workarounds.
- Client-facing experience: How clean and intuitive the dashboard looks from the client's side, including how easy it is to share access via a secure link or login.
- White-labeling and branding: How much control you have over the look of the dashboard, including custom logos, colors, and domain options.
- Ease of setup: How quickly you can go from a blank canvas to a working, shareable dashboard without needing technical help.
- Reporting automation: Whether the tool can send scheduled reports automatically or requires manual exports every time.
The tools that impressed me most were the ones where the setup was straightforward and the client-facing result still looked polished and professional.
Final verdict
AgencyAnalytics and Databox are solid picks for marketing agencies that need client-facing reporting, while DashThis and Whatagraph work well for teams managing multiple clients with white-label needs. Klipfolio is worth considering if you need more flexibility in how your data is visualized.
If you want your dashboard inside of a broader client experience, Assembly is a client portal platform that lets you embed dashboards from Looker Studio, Databox, and other tools directly into a branded portal. Your messages, files, and billing live there too, so clients aren't logging into multiple places to find what they need.
Here's how Assembly can help:
- Give clients a branded portal: Clients log into a space that reflects your brand to access contracts, invoices, files, and project updates. You can also set up dynamic homepages so each client automatically sees content tailored to their specific services and engagement, without any manual changes on your end.
- Embed dashboards: Embed reports from Looker Studio, Databox, Power BI, Google Sheets, and other tools directly inside each client's portal, so clients don't need a separate login to see their data.
- Organized report delivery: App Folders let you group dashboards, analytics tools, and external links into named folders inside the portal, so clients find their reports without digging around.
- Keep tasks, messages, and files together: Client communication, shared files, and project tasks stay connected to each client record in one place, so nothing gets buried across multiple platforms.
- Prep faster for client calls: The Assembly AI Assistant summarizes recent client activity and communication, helping you walk into calls with a clear picture of what’s been discussed and what’s outstanding.
Assembly may not replace a dedicated dashboard tool if your reporting needs are complex or heavily data-driven. But for firms that want clients to log into a branded experience where dashboards, invoices, files, and messages all stay in one place, it's worth a closer look.
Start your free Assembly trial today.
Frequently asked questions
What is the difference between a client dashboard and an internal dashboard?
A client dashboard is a shared view built for your clients, while an internal dashboard is built for your team. Client dashboards show project data, KPIs, and results relevant to that client only. Internal dashboards typically include sensitive data like team capacity, margins, and cross-client performance.
What should a client dashboard include?
A client dashboard should include the KPIs, milestones, and performance metrics most relevant to the work you're doing for that client. For marketing agencies, that tends to mean campaign performance, traffic, and conversions. For project-based work, task progress, deadlines, and deliverable status are more useful. Focus on metrics that show results, not every data point you track internally.
How do you create a client dashboard?
You can create a client dashboard by choosing a tool, connecting your data sources, and building a view that shows only the metrics relevant to that client. Most purpose-built tools like AgencyAnalytics and DashThis offer templates and drag-and-drop builders that don't require technical setup.
Your clients deserve better.
Try for free for 14 days, no credit card required.